Resuming from part 1, this post continues in outlining the steps for developing a roads web map, next discussing styling vector tiles with maputnik.
First, start a tileserver-gl instance on localhost with the roads.mbtiles database from part 1, using the –verbose parameter to display the configuration options, which we can use later:
docker run --rm -it -v $PWD:/data -p 80:80 klokantech/tileserver-gl --verbose
Next, access the tileserver frontend via a browser by connecting to localhost:8080, and click the TileJSON button to obtain a url for the served data – something like: http://localhost/data/road.json. Make note of this url.
To style the data, we can use the maputnik editor, also available to run locally via Docker, as below. Note that a previous edit of this post used the online editor, but this now blocks HTTP requests (i.e. our localhost data source) due to CORS. If we also run maputnik on localhost, this gets around the problem.
docker run --rm -it -p 8888:8888 maputnik/editor
Connect to the app at http://localhost:8888/, which will likely display a default example style, so first clear this by selecting Open from the header, and from the gallery options, Empty Style. Next, set a name and owner for the new style under the Style Settings tab.
We can now add our server data from the Data Sources tab, under Add New Source. To do this, set the source type to TileJSON, the url to your localhost url from earlier, choose a suitable ID, then hit Add Source.

The next step is to add that layer to the style with the Add Layer button of the Layers pane. Set the source ID from above, the name of the layer to style, and a layer ID (here all are simply “road”), and set the (geometry) type to line, then click Add Layer.

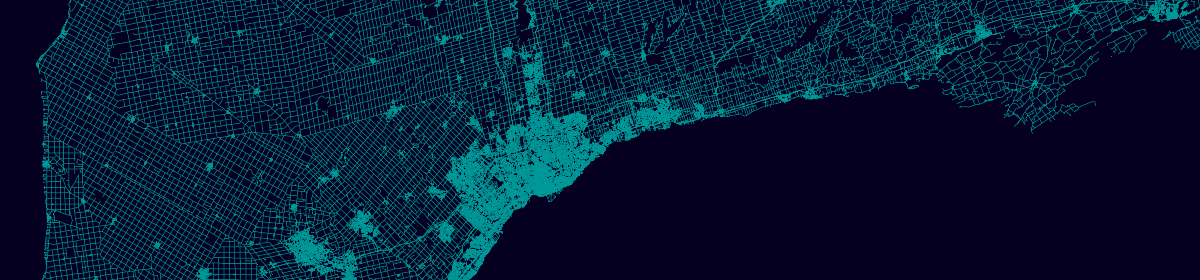
Note that the roads layer may be outside the current map bounds and not immediately visible, so browse to http://localhost:8888/#4/50/-80 to center the map on Ontario, where if all is well, the roads layer should be visible, with default styling options applied.
We can customize the styling of the roads layer with various options in the layers panel. For example, adjusting the min and max zoom levels the layer is displayed, the color, and the width, as below. Here, I’ve set the width to vary by zoom level, to improve visualization. This can be done by clicking the epsilon button ![]() and setting min/max values for the range: 0.1 px at zoom level 4 to 1 px at zoom levels 10+.
and setting min/max values for the range: 0.1 px at zoom level 4 to 1 px at zoom levels 10+.

Also add a background layer with the same Add Layer control, and set a suitable fill color under Paint properties. Make sure to drag the new layer below roads in the layer panel, otherwise it will be drawn above it.

With this basic style complete, hit the Export button, and download the style as a JSON file. We can now create a config JSON file for tileserver-gl to use the style, based on the default config that is displayed by the –verbose option of the earlier tileserver-gl run. Create something like the below with a text editor, changing the “style” and “mbtiles” paths as needed. Save this in the same directory as your .mbtiles file as config.json.
{
  "options": {
    "paths": {
      "root": "/usr/src/app/node_modules/tileserver-gl-styles",
      "fonts": "fonts",
      "styles": "styles",
      "mbtiles": "/data"
    }
  },
  "styles": {
    "road": {
      "style": "/data/styles/mapping_on_roads.json"
    }
  },
  "data": {
    "road": {
      "mbtiles": "road.mbtiles"
    }
  }
}
Restart the tileserver-gl instance to read from the new config file, and again connect to the app at localhost. Click Viewer to generate a sample map, and check that your style file has been applied.


The next and final step will be to display the same styled vector tiles in a web map outside of tileserver, the topic of the next post.