I usually download, store, and process data on my own local machines, archiving the raw data, possibly ingesting it to a database, and then writing scripts for further processing and analysis. This approach can quickly become problematic for particularly large datasets, however, due to limits on available disk space for storage or network speeds for downloading, or insufficient cpu power and memory capacity for effective processing. Rather than investing in additional computing resources, one solution to this kind of problem is Google Earth Engine, a web service that can do this kind of processing for you for free, with ready access to a wide range of data sources.
One such use case is to create a cloud free satellite image mosaic from a time series of satellite imagery. Assembling this yourself would require the download of a potentially large number of images, and writing an algorithm to filter and combine them in memory, likely requiring significant computing resources.
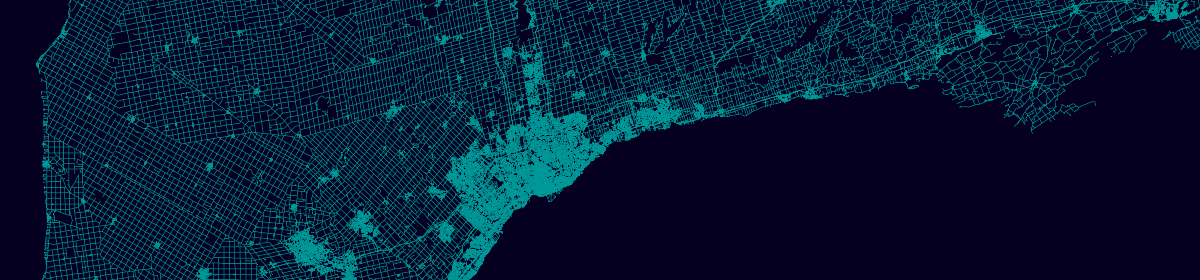
Here, I will demonstrate using Google Earth Engine (GEE) to assemble a filtered time series of satellite image tiles from the Copernicus Sentinel-2 mission, then mask cloud cover, and mosaic (merge) them into a single high resolution RGB image. To get started with GEE, sign up for a free account at: https://signup.earthengine.google.com/ and open the code editor at: https://code.earthengine.google.com.
The GEE code editor is a web based IDE, including a text editor to write and run scripts, a console to display information and errors, an interactive map to visualize results, and built in access to examples and documentation. GEE code is written in JavaScript, utilizing a library with a variety of special functions for image processing (prefixed with ee).
Count Tiles
First, we need to choose a location for the time series, and a date range that has sufficient non-cloudy tiles (<10% cloud cover) for creating the mosaic image. From some trial and error, I found July-September 2021 to be such a time period for my selected area of Prince Edward County, Ontario.
To replicate, add the below code to your new script (the center panel) and click Run. This will load in a time series of Sentinel imagery based on the specified date, location and cloud cover filters, check how many tiles were returned, and finally visualize the results in the map panel.
// Define parameters for run: date range, extent, projection, and map location.
var minDate = ee.Date('2021-07-01');
var maxDate = ee.Date('2021-09-30');
var geom = ee.Geometry.Rectangle([-77.70, 43.82, -76.79, 44.2]);
var affine = [0.00026949458523585647, 0, -180, 0, -0.00026949458523585647, 86.0000269494563];
Map.setCenter(-77.2, 44.0, 10);

// Read the Copernicus Sentinel 2 collection, and filter by date, bounds, and cloud cover, then select the bands of interest.
var s2Sr = ee.ImageCollection('COPERNICUS/S2_SR')
    .filterDate(minDate, maxDate)
    .filterBounds(geom)
    .filter(ee.Filter.lt('CLOUDY_PIXEL_PERCENTAGE', 10))
    .select(['B2', 'B3', 'B4', 'B5', 'QA60']);

// Create an image with the tile overlap count per pixel from a reference band, and clip to geom.
var count = s2Sr.select(['B2']).count().clip(geom);

// Get the min max range of the image.
var minMax = count.reduceRegion({
    reducer: ee.Reducer.minMax(),
    geometry: geom,
    crs: 'EPSG:4326',
    crsTransform: affine
  });
var min = minMax.get('B2_min').getInfo();
var max = minMax.get('B2_max').getInfo();

// Visualize the layer on the map.
var countViz = {
  min: min,
  max: max
};
Map.addLayer(
  count,
  countViz,
  'count'
);
Add a Legend
Although the map values are color coded, exactly what it shows is unclear without a legend. To add a legend to the map, additionally run the below code, defining a function for generating a legend and then applying it to the counts layer. There should be no less than three images present in any given location with these filters, which is enough to remove the clouds without leaving gaps in this case.
function addContinuousLegend(viz, title) {

  // Create legend title.
  var legendTitle = ui.Label({
    value: title,
    style: {
      fontWeight: 'bold',
      fontSize: '18px',
      margin: '0 0 2px 0',
      padding: '0'
    }
  });

  // Create the legend color ramp image.
  var lon = ee.Image.pixelLonLat().select('latitude');
  var gradient = lon.multiply((viz.max-viz.min)/100.0).add(viz.min);
  var legendImage = gradient.visualize(viz);

  // Create a thumbnail from the image.
  var thumbnail = ui.Thumbnail({
    image: legendImage,
    params: {bbox:'0,0,10,100', dimensions:'10x200'},
    style: {padding: '1px', position: 'bottom-center'}
  });

  // Create legend with title, min-max values, and color ramp bar.
  var legend = ui.Panel({
    widgets: [
      legendTitle,
      ui.Label(viz['max']),
      thumbnail,
      ui.Label(viz['min'])
    ],
    style: {
      position: 'bottom-right',
      padding: '10px 10px'
    }
  });

  // Add legend to current map.
  Map.add(legend);
}

addContinuousLegend(
  countViz,
  'count'
);

Identify Cloudy Pixels
There are a couple of examples of applying a cloud reduction algorithm to Sentinel 2 imagery provided by Google here and here. Below, I have combined and refined the two to create a mask layer with the locations of cloudy pixels. This is then overlaid on the map to show areas where at least one of the tiles is determined to have clouds present.
// Join two collections on their 'system:index' property.
// The propertyName parameter is the name of the property
// that references the joined image.
// Function taken from: https://code.earthengine.google.com/?scriptPath=Examples%3ACloud%20Masking%2FSentinel2%20Cloud%20And%20Shadow
function indexJoin(collectionA, collectionB, propertyName) {
  var joined = ee.ImageCollection(ee.Join.saveFirst(propertyName).apply({
    primary: collectionA,
    secondary: collectionB,
    condition: ee.Filter.equals({
      leftField: 'system:index',
      rightField: 'system:index'})
  }));

  // Merge the bands of the joined image.
  return joined.map(function(image) {
    return image.addBands(ee.Image(image.get(propertyName)));
  });
}

// Cloud detection algorithm, combined from functions at:
// https://code.earthengine.google.com/?scriptPath=Examples%3ACloud%20Masking%2FSentinel2%20Cloud%20And%20Shadow
// and
// https://code.earthengine.google.com/?scriptPath=Examples%3ADatasets%2FCOPERNICUS_S2
function getCloudsMask(image) {
  var cdi = ee.Algorithms.Sentinel2.CDI(image);
  var cloudProb = image.select('probability');
  var cirrus = image.select('B10').multiply(0.0001);
  var qa = image.select('QA60');

  // Bits 10 and 11 are clouds and cirrus, respectively.
  var cloudBitMask = 1 << 10;
  var cirrusBitMask = 1 << 11;

  // Combine cloud cover layers to create a mask.
  var mask =
    (
      qa.bitwiseAnd(cloudBitMask).gt(0)
      .or(qa.bitwiseAnd(cirrusBitMask).gt(0))
    ).or(
      cloudProb.gt(65).and(cdi.lt(-0.5))
    ).or(
      cirrus.gt(0.01)
    );
  return mask;
}

// Read additional image collections for cloud detection.
var s2 = ee.ImageCollection('COPERNICUS/S2')
    .filterDate(minDate, maxDate)
    .filterBounds(geom)
    .select(['B7', 'B8', 'B8A', 'B10']);
var s2Clouds = ee.ImageCollection('COPERNICUS/S2_CLOUD_PROBABILITY')
    .filterDate(minDate, maxDate)
    .filterBounds(geom);

// Join the cloud probability dataset to surface reflectance.
var withCloudProbability = indexJoin(s2Sr, s2Clouds, 'cloud_probability');

// Join the L1C data to get the bands needed for CDI.
var dataset = indexJoin(withCloudProbability, s2, 'l1c');

// Apply the cloud masking algorithm to create an image mask.
var clouds = dataset.map(getCloudsMask);

// Mask and clip the layer.
var totClouds = clouds.sum().gt(0).selfMask().clip(geom);

// Visualize the layer on the map.
var cloudsViz = {
  min: 1,
  max: 1,
  palette: 'red'
};
Map.addLayer(totClouds, cloudsViz, 'clouds');

Remove Clouds
With the clouds mask, it is now a case of removing those pixels from the affected tiles, and finally taking an average (median) of what remains the create a cloud free mosaic. To visualize the results, a SplitPanel can be used to place two maps side by side, with a slider to switch the display between them, to see the areas where clouds have been removed, as below.
// Select RGB bands, and join clouds mask.
var withCloudMask = indexJoin(dataset.select(['B2', 'B3', 'B4']), clouds, 'QA60');

// Make another map to display the output layer.
var linkedMap = ui.Map();

// Map the cloud masking function over the joined collection.
var masked = ee.ImageCollection(withCloudMask.map(function(img) {
  return img.updateMask(img.select('QA60').eq(0));
}));

// Take the median values across the timeseries, specifying a tileScale to avoid memory errors.
var median = masked.reduce(ee.Reducer.median(), 8);

// Crop layer to target geometry.
var rgb = median.clip(geom);

// Add the layer to the second map.
var viz = {
  bands: ['B4_median', 'B3_median', 'B2_median'],
  min: 0,
  max: 3000
};
linkedMap.addLayer(rgb, viz, 'median');

// Link the default Map to the second map.
var linker = ui.Map.Linker([ui.root.widgets().get(0), linkedMap]);

// Create a SplitPanel which holds the linked maps side-by-side.
var splitPanel = ui.SplitPanel({
  firstPanel: linker.get(0),
  secondPanel: linker.get(1),
  orientation: 'horizontal',
  wipe: true,
  style: {stretch: 'both'}
});

// Set the SplitPanel as the only thing in root.
ui.root.widgets().reset([splitPanel]);

The full and final script for all these steps can be accessed here.